UV-Vis
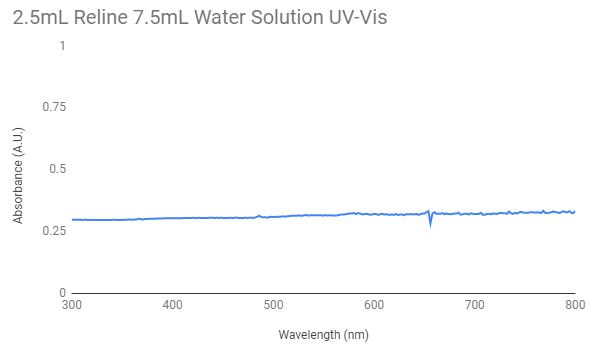
This is the graph for the nanoparticles synthesized in a 2.5mL reline and 7.5mL water solution. As there is no significant peak in the graph it indicates that there was no presence of gold nanoparticles in the solution. For the testing 3mL of the solution was used.
|
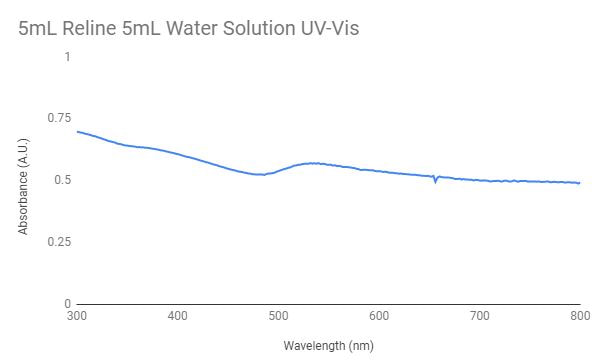
This graph represents the UV-Vis for the gold nanoparticles synthesized in 5mL reline and 5mL of water. There is a peak around the 500nm wavelength which possibly indicates the formation of gold nanoparticles in the solution. To test in UV-Vis 1mL of this solution was added to 2mL of ethanol.
|
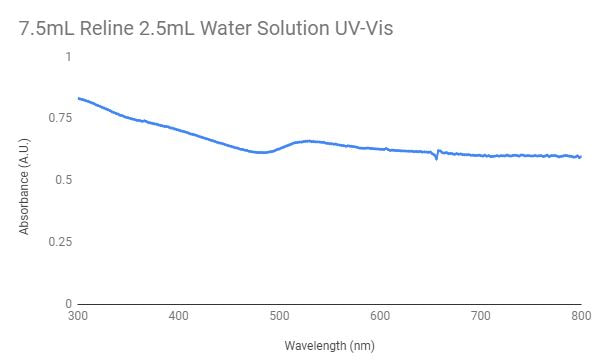
The graph above shows the UV-Vis graph for the 7.5mL reline and 2.5mL water solution used to synthesize the gold nanoparticles. The peak in the graph shows that the presence of gold nanoparticles is probable. In order to test by UV-Vis, 2mL of the solution was mixed with 1mL of ethanol.
|
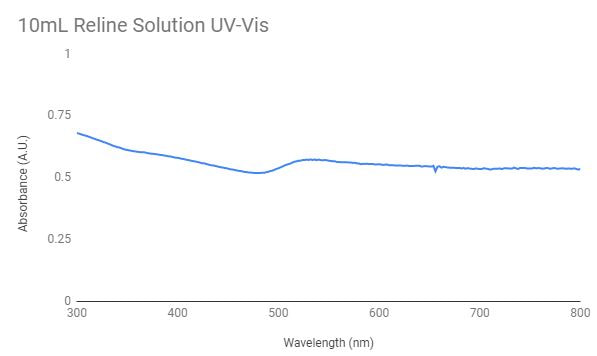
This shows the UV-Vis graph for the 10mL reline solution, so reline with no water added to the solution. Because there is a peak around the 500nm wavelength gold nanoparticles were most likely formed in the solution. To test 3mL of this solution was used.
|
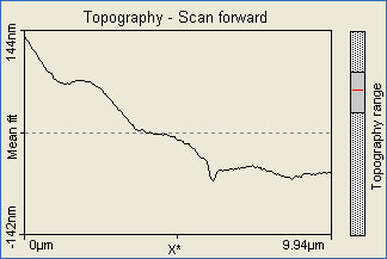
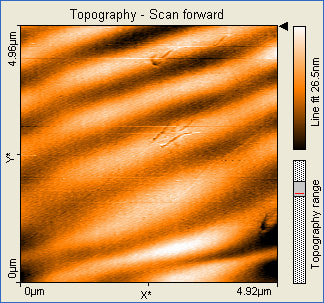
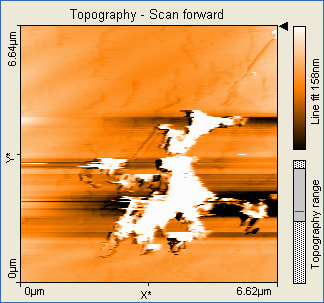
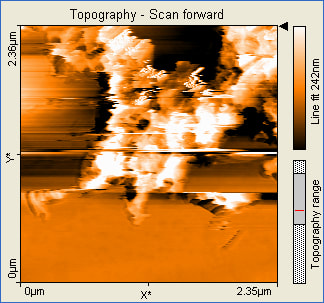
Atomic Force Microscopy
|
|
These pictures show that the formation of gold nanoparticles did happen in the 10mL reline solution. The pictures also show that the nanoparticles formed were not actually nostructures instead nanowires were formed. The size of the nanowires also indicates that they formed an aggregate and clumped together.
Coulometric Titration Results
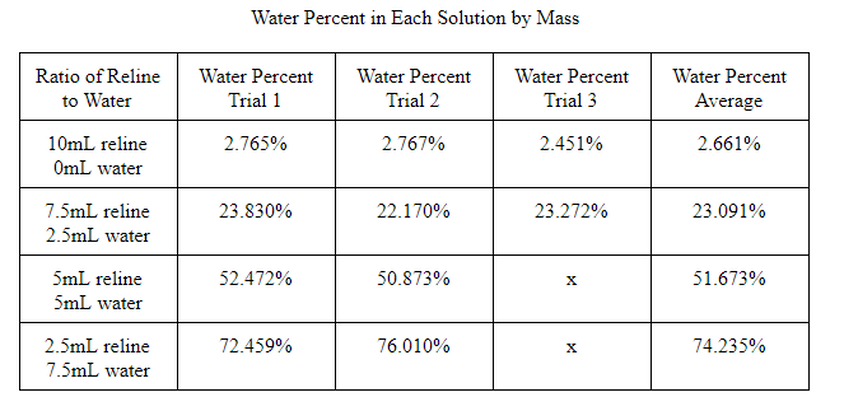
The water percent by mass was measured using the coulometric titrator. For the 5mL and 2.5mL reline solutions a third trial was not taken due to a lack of time.
